by David Maddox
Who doesn’t love a list? The 100 richest people in the world. The best guitar players of all time. The most beautiful beaches in the world. The world’s “greenest cities”. The USA’s most livable cities. The most resilient cities. For people interested in the particular theme of the list, the lists are fascinating. We can compare them against our own ideas and experience. We can debate and complain about the order. (I personally agree with Jimi Hendrix at number 1 in Rolling Stone’s list of guitar players, but think that Ry Cooder at #31 is scandalously low.)
Some lists are based on simple and easily understood data, such as the Forbes list of 2012’s richest people in the world. Let’s accept as correct Carlos Slim Helú’s valoration ($69 billion) and agree he has the most scratch. Among the swells, Mukesh Ambani, whose personal skyscraper towers above Mumbai and has a green wall, is a laggard and in the (relative) poorhouse at #20. A list of the most beautiful beaches, like the guitar players, is much more subjective, but nevertheless is grounded in a set of attributes, such as the beauty of the physical setting, the soft whiteness of the sand, and so on.
Lists are about values

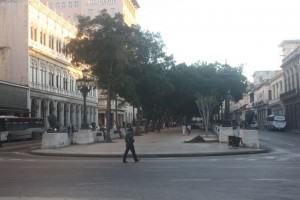
Is this city greener …(the Paseo de Martí in Havana, Cuba) Photo by David Maddox
The critical think to keep in the front of one’s mind when pondering all such lists is that they are based on values, which are in turn based on concepts of what is important. That is, lists are grounded in a set of underlying indicators: elements or attributes that the creators of the list believe to be most central to the idea of “best of” in their particular category. If the creators left the attribute you think is most important out of their set of attributes for valoration, well, it was because they didn’t think it was important enough.
But if it is important it should be included in the foundational data that informs the list. And let’s be clear: if an attribute is left out of a valuation, then it affects the overall rankings and our overall impression of what’s “important”.

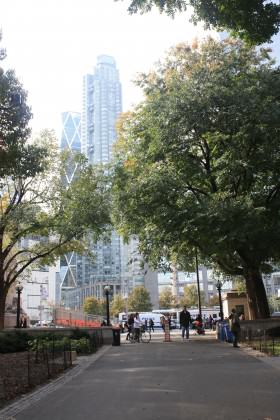
…than this one? How would you know? View from Central Park toward Columbus Circle, New York City. Photo by David Maddox.
Let us not think of “values” as simply being opinions. For any personal interest of ours, each of us has a set of attributes – a mental conceptual model, if you will – that we believe are key to qualities that are central to the idea of “better”. It is the same with lists, whether they are subjective (e.g., most over-rated footballer) or objective (i.e., something that is data- driven).
In data-driven best-of lists the values of the creators are expressed, or revealed, in:
(1) The attributes that are included in the valuation, and;
(2) The relative weights that are given to each attribute.
Note that the relative weighting of different attributes is also critical. Equal weighting is not an absence of weights, and essentially “values” all attributes equally. This is an expression of values.
Comparative lists of the attributes of cities
What is great about data-driven lists is that they facilitate apples vs. apples comparisons.
(1) We can compare a single city’s performance through time: is it improving based on the attributes used?
(2) We can compare among cities on standard scales, across time or across regions.
(3) If we can understand what is going on in the data we have chosen to use, then we might understand how our values are being expressed in terms of city performance and, importantly, in which specific areas we are succeeding or failing.
Certainly we can’t include all attributes into such rankings – that is the role of more detailed question-driven science and monitoring (say, Singapore’s city biodiversity index). But knowing what is in them is critical to understanding what to think of the final list and how to use it for good. How is it, for example, that New York City often scores low on “green” when in fact we use less water per capita, less energy per capita, use more public transportation, and have a tree canopy of 24% of total area? It is because of the values expressed in the construction of the list. Right, it’s complicated.
What can be great about lists is when they inspire (or sometimes embarrass) us into greater attention to both appropriate measurements and desired outcomes. At the heart of this idea is the importance of information in decision-making. My own city, New York, has generally been good at this – taking a information-rich and data-driven approach to planning.
Under the hood of “Most Green” and “Most Livable” cities lists
There are quite a few “most green city” and “most livable city” lists. And let me say right now, and with emphasis, that I think they are generally interesting and can be useful. But it is also important to know what values lay inside them. So, what are the values inherent in such lists? What “green” attributes drive the ranking of cities?
I can tell you that it is generally not biodiversity or the performance of ecosystem services. Even green space (typically expressed as the total area of park land or open space) is given a relatively modest role. Although the methods are typically only seen through a veil, the principle drivers in most of these lists are attributes involving energy, transportation, and public transportation. Water use is rarely included. Air quality, which is really an outcome related to energy and transportation, but which is also driven significantly by green infrastructure (e.g., parks and street trees), is occasionally included.
Take for instance a popular and impressive valoration by Siemens, the Green City Index. One element that is impressive is its attempt to include multiple cities across most regions of the world. Thus, we can ask about sustainable cities in Africa, or Asia, not just Europe and the U.S. (This is important because there are generally more data available in the U.S. and Europe, so I applaud Siemens for seeking out the harder to find data in other places.)
The exact methods are not made public, but the list below shows the attributes they include.
- CO2 emissions – total emissions
- Energy – use of renewables
- Land Use – including the % of the “green space” as part of the total city area
- Buildings – energy efficient buildings
- Transportation – public transportation networks
- Water – water use per capita
- Waste – existence of robust waste policies
- Air – the existence of air quality policies and targets
- Environmental Governance – existence of environmental planning
Note that they don’t include biodiversity or any meaningful measures of natural areas. The nine categories appear to be weighted equally. Parks and green space are placed in the category Land Use. This is the usual state of affairs. Just a few examples of recent lists of “Green” or “Sustainble” or “Livable” include those from PopSci, Mother Nature Network, Grist, and Country Home, and Scientific American has done a review of such lists in various categories. Attributes involving biodiversity, natural areas, protection of wetlands, street trees, or even water use are rare.
This needs to change.

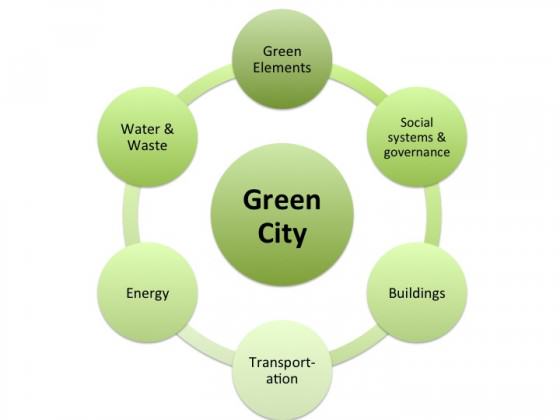
A conceptual model for a green city that includes green infrastructure as a key driver. Graphic by David Maddox.
Making Most Green Cities lists better and inspiring more data collection
A mountain of research demonstrates that biodiversity, nature, and ecosystems in cities contribute to a wide array of desirable outcomes, from conservation and ecosystem services to sustainability, human wellbeing, community cohesion, and resilience to shocks. Indeed, in many cases they are drivers of key urban outputs such as air quality, storm water management, population health, housing prices, and quality of life.
In turn, these core components of “green” cities are the ones that also play a key role in determining livable and resilient cities. Browse other essays in this blog to see examples and links. TNOC contributor Marina Alberti wrote a textbook full of examples. Tim Beatley (another TNOC contributor) and colleagues make a similar argument in their new book “The Green Cities of Europe”.
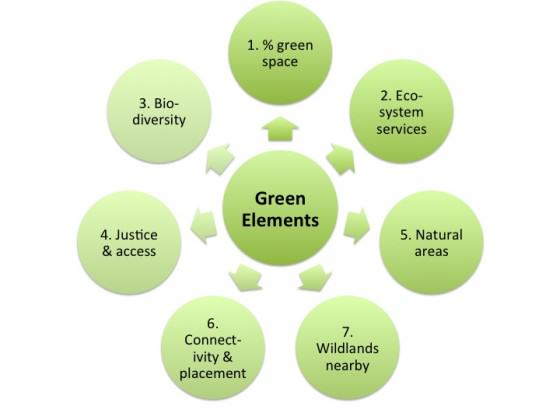
So, here are some recommendations for attributes to include in future valorations of green cities – what we might call a fully specified conceptual model of the “Green Elements” of a green city.
(1) Green: High amounts of parkland, green, or blue space relative to the size of the municipal area. (This is measure typically included in green city lists today).
(2) Ecosystem services: Significant examples of investment in green infrastructure, including green roofs, bioswales, rain gardens, permeable surfaces, etc.
(3) Biodiversity: Demonstrated biodiversity, and institutional commitment to locally native species.
(4) Justice: Equitable distribution of this green or blue space among neighborhoods within the city (or related connectivity among parcels).
(5) Natural areas: High amounts of “natural areas” as a part of the green and blue space (i.e., not simply parks that are for recreation).
(6) Connectivity and Placement: Green areas that connected and placed purposefully relative to known threats (e.g., wetlands in the path of storm surge).
(7) Wildlands: Parkland, including significant natural or wilderness areas, within one-day’s journey from the city center.

A conceptual model for the elements of critical green in a “green” city. Graphic by David Maddox.
The specifics of each are of course arguable, as are their relative weighting. Also arguable is the weighting of these attributes relative to the commonly included transportation, energy, and so on. What is not arguable is their importance to urban sustainability, resilience, and human wellbeing – to the “Greenness” of a city. In some form, they belong in the methodology of any organization creating “Most Green City” lists.
And, more importantly, they belong in the conversations of the people planning and managing the cities.
So what? It’s just a list
Including such attributes among the values inherent in the methodology will change the ranking of cities – as any new metric would. But since nature, ecosystems and biodiversity are critical to “greenness” and sustainability, leaving them out, as the rankings now largely do, creates incorrect or misleading lists, which impedes both planning for improvements in these areas, but also corrupts pubic perception about what makes up a “green”, “sustainable”, and “resilient” city.
Greener cities are not only made up of LEED buildings, transit systems, energy sources, density planning and building codes. Green cities are also those that value and implement strategies for some of the key drivers of healthy and livable cities. This is more than just undifferentiated “green space”. It is coherent and connected planning for and evidence of parks, street vegetation, natural areas, and various provisions for ecosystem services. And, support for and interest in public engagement in the creation of an equitable experience in their benefits – that is, the creation of a real green ethos embedded deep in the philosophy of the city.
Yes, lists are silly diversions. Except that rankings are important because they both reflect andperpetuate our basic values about cities and what they are made of.
Elevate biodiversity, ecosystem services, and nature in cities to the levels of value they deserve.
David MaddoxNew York City, USA